

A single source of truth for your portfolio performance
Trend pulls data from your building systems into a consolidated view. Track KPIs, monitor ESG metrics, and compare performance across your assets in personalised dashboards.
No manual consolidation. Accelerate decisions.
















THE TRIGRR ECOSYSTEM
One unified platform for every stakeholder
Get clear insights from your data
Portfolio performance in one dashboard:
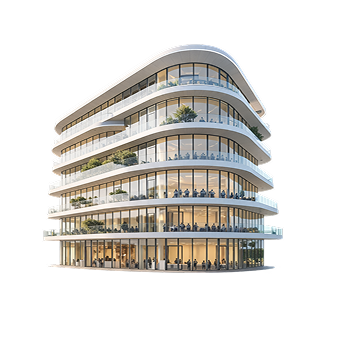

Common layer, connecting every building system
Real-time control experience over the building environment
Track portfolio performance from personalised dashboards
Proactive anomaly and fault detection
BENEFITS
Turn building data into a clear operational view
Your building performance data already exists. Trend turns it into clear, actionable insights across your entire portfolio.

See how your portfolio actually performs
Track energy and operational metrics across every building, from one place. No more fragmented views or inconsistent data.

Make faster, better investment decisions
Identify underperforming assets, compare buildings, and prioritise actions based on real performance data, not assumptions.

Deliver ESG reporting without last-minute pressure
Your data is already structured, aligned, and ready to export. No spreadsheets, no manual consolidation before deadlines.

Align teams around the same data
Asset managers, sustainability teams, and operators work from a shared data foundation, improving coordination and decision-making.
FEATURES
Explore, analyse and compare your portfolio performance
Trend gives your team a continuous view of building performance and alerts them when something requires attention.
Visualise performance clearly
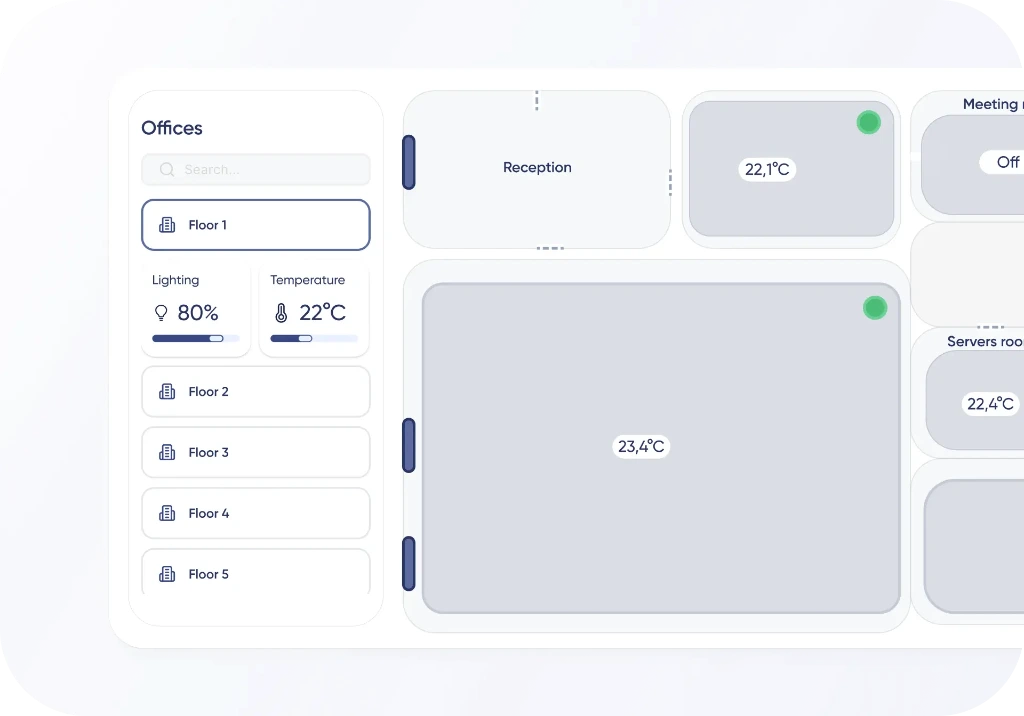

2D map
Visualise data across buildings, floors and zones
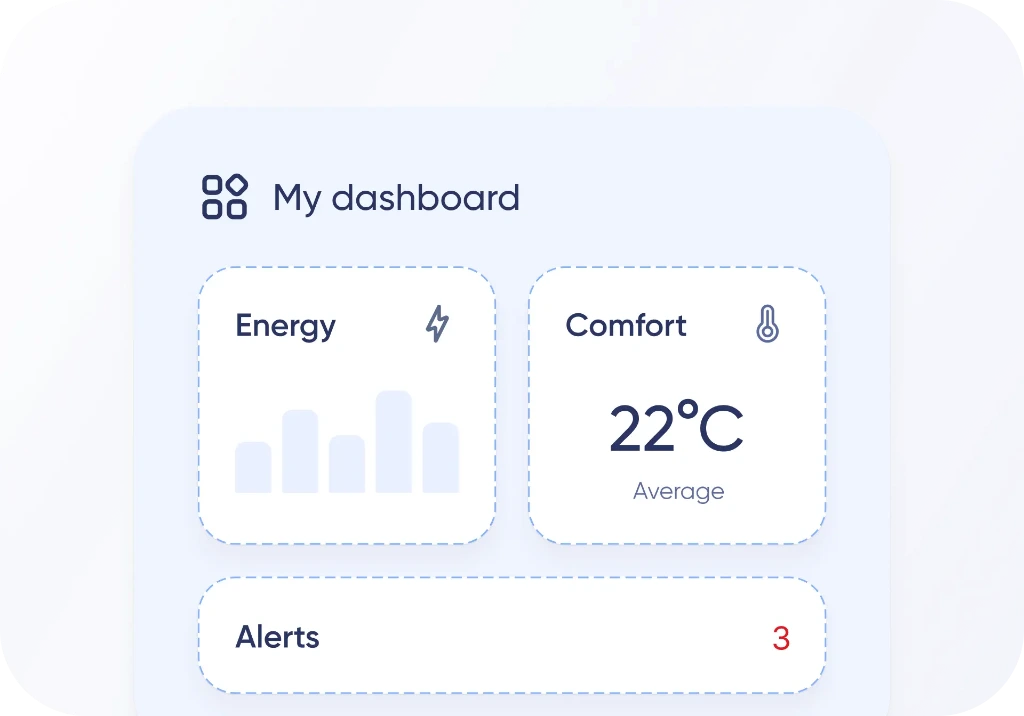

Configurable dashboards
Set up dashboards with the metrics and views you need
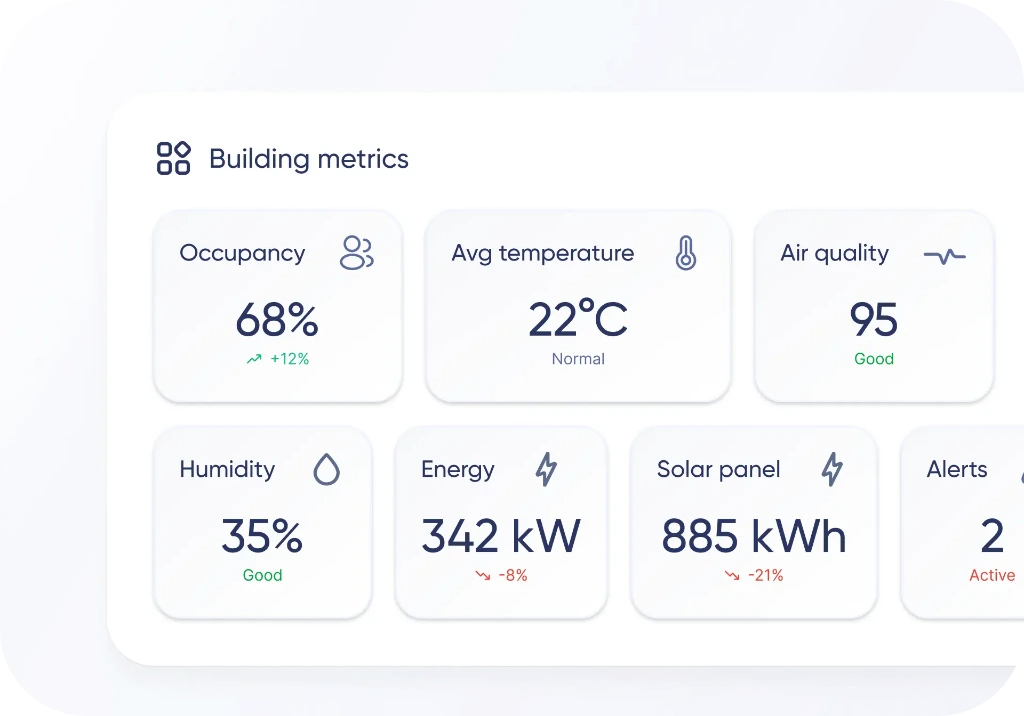

iWidgets
Add widgets to display specific KPIs and data points
Analyse one asset or an entire portfolio
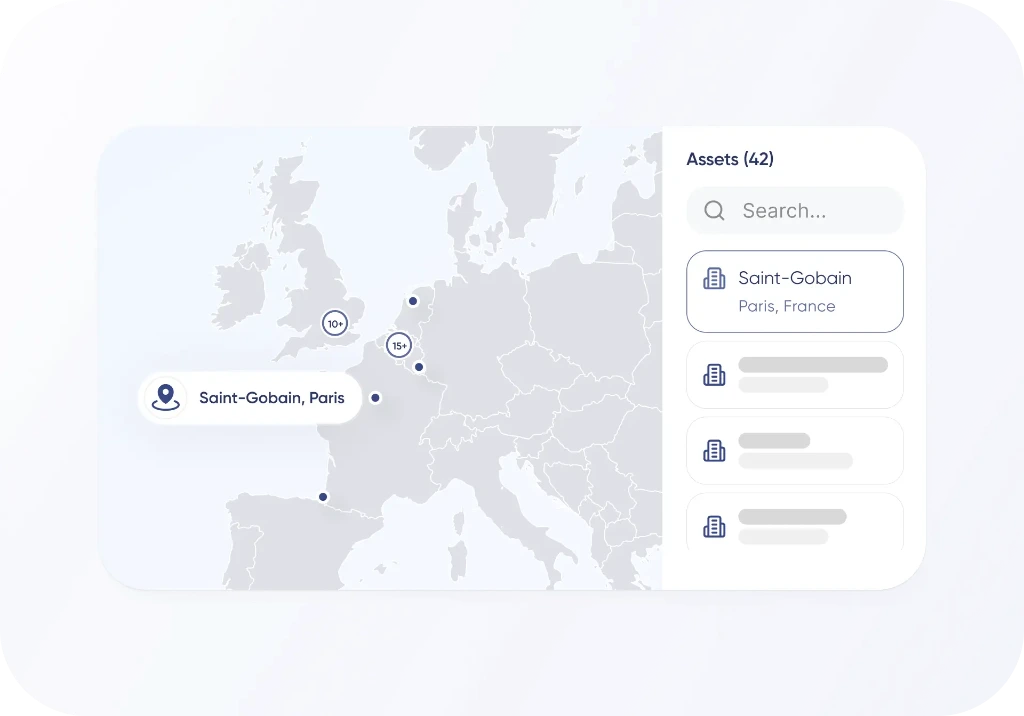

One or multiple assets
Switch between single-asset and portfolio views

Performance tracking
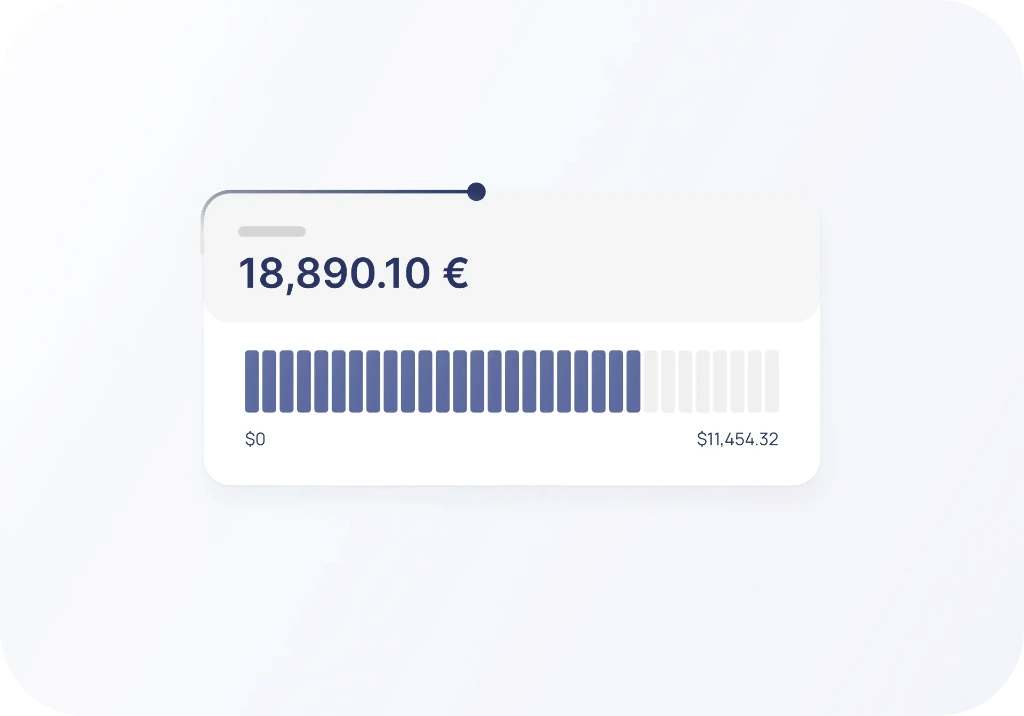
Track KPIs such as energy intensity, equipment performance, or indoor conditions across buildings and time

 Coming soon
Multi-asset dashboard
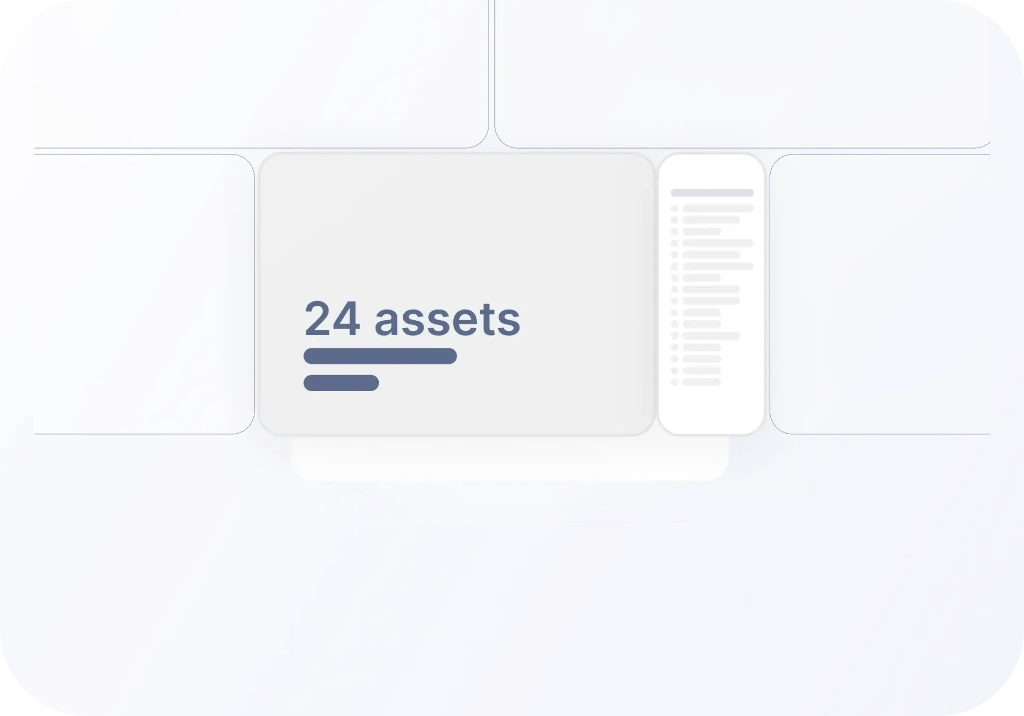
Compare multiple assets in a single dashboard
Share updates and support reporting

Reporting
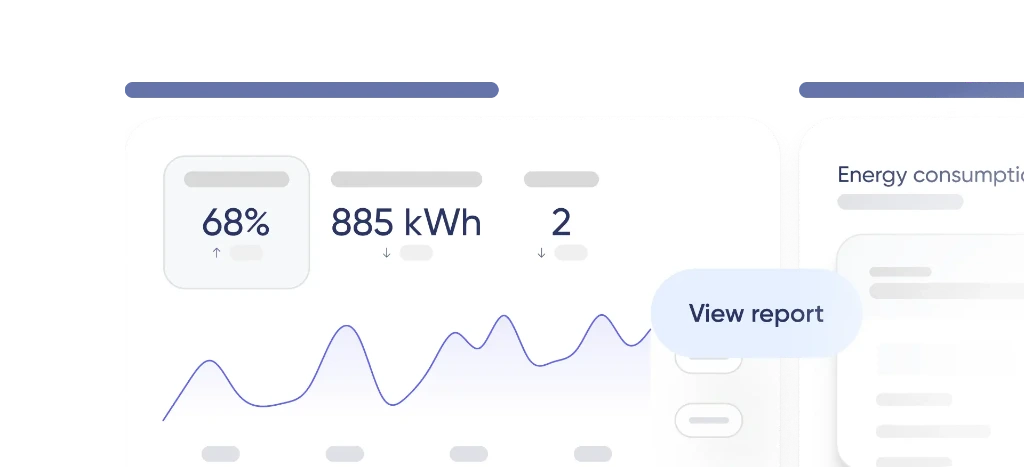
Generate or export reports based on your dashboards, KPIs, or any other requirements


Notifications
Receive alerts when selected metrics reach defined thresholds
Enrich your current tools

Connect your data to Power BI

Advanced ESG reporting


Your full portfolio visibility from one platform
Bring together data from every building system into one place, and turn it into a clear, consistent view across your assets.
WORKFLOWS
How Trend makes data actionable
Your BOS deployment starts from the systems already installed in the building.
Assessment & technology mapping
Your integrator reviews your systems and constraints to identify available opportunities.
System integration
Systems are connected through Trigrr's library of connectors, enabling secure and bidirectional data exchange.
Data structuring
Equipment and data are unified, ensuring consistent and usable information across the platform.
Configuration & deployment
Dashboards, automations, and alerts are set up to match your operational needs.
Performance tracking
Data trends and deviations are continuously tracked over time, to support decision-making.